
If you are having a hard time making sense of what is going on in the economy and financial markets right now, you are not alone. The past four months have taken investors on a dizzying rollercoaster ride, making it difficult to make heads or tails of economic data and financial market movements for investors and analysts alike. While there has been a great deal of positive news in the second quarter to offset the dismal developments of February and March, the outlook for the second half of 2020 remains foggy and uncertain.
Financial planning endeavors over the next sixth months are likely to remain challenging because of uncertainty and conflicting reports about the efficacy of efforts and strategies aimed at curtailing the Covid-19 pandemic. On top of the pandemic, the Presidential election in November adds another layer of complexity and ambiguity to our financial planning efforts. Despite all these headwinds, we can take a few lessons from the past quarter and apply them to our planning efforts for the remainder of 2020.
A Recap of The Second Quarter
Many investors feared the worst at the onset of the second quarter. Just weeks earlier in February the S&P 500 index dropped 10% in six short trading days. On March 9th, the S&P 500 dropped 7.6%, triggering the market circuit breaker to suspend trading temporarily for the first time since 1997. More tumultuous days would follow March 9th as the economy stalled, entire industries shut down and thousands of workers lost their jobs.
The economic news would get worse before it got better. Twenty million jobs were lost in April as states imposed more closures and restrictions on a variety of industries and occupations. The unemployment rate, which began the year near historic lows of 3.6%, surged to 14.7% in April. The unemployment rate dropped to 11.1% in June, as 2.5 million jobs were added as quarantines and forced business closures were lifted in many states.
Despite all the gloomy economic data, U.S. stocks very quietly had their best quarterly returns in twenty years. The Dow Jones Industrial Average (DJIA) gained 18% in the second quarter, for its best quarterly performance since 1987. The S&P 500 index finished the second quarter slightly better with a 20% gain. The second quarter was the index’s best quarterly gain since the fourth quarter of 1998. Finally, the NASDAQ composite index finished the second quarter up 31%.
The strong equity market performance of the second quarter was not limited solely to U.S. markets. In fact, fifteen aggregate foreign equity market indices had stronger performance than the U.S, led by Argentina and Australis with returns of over 30% in the second quarter. Looking at broader market returns, every broad international market index also had positive returns in the second quarter, with developed international markets returning 15% and emerging markets returning 18%.
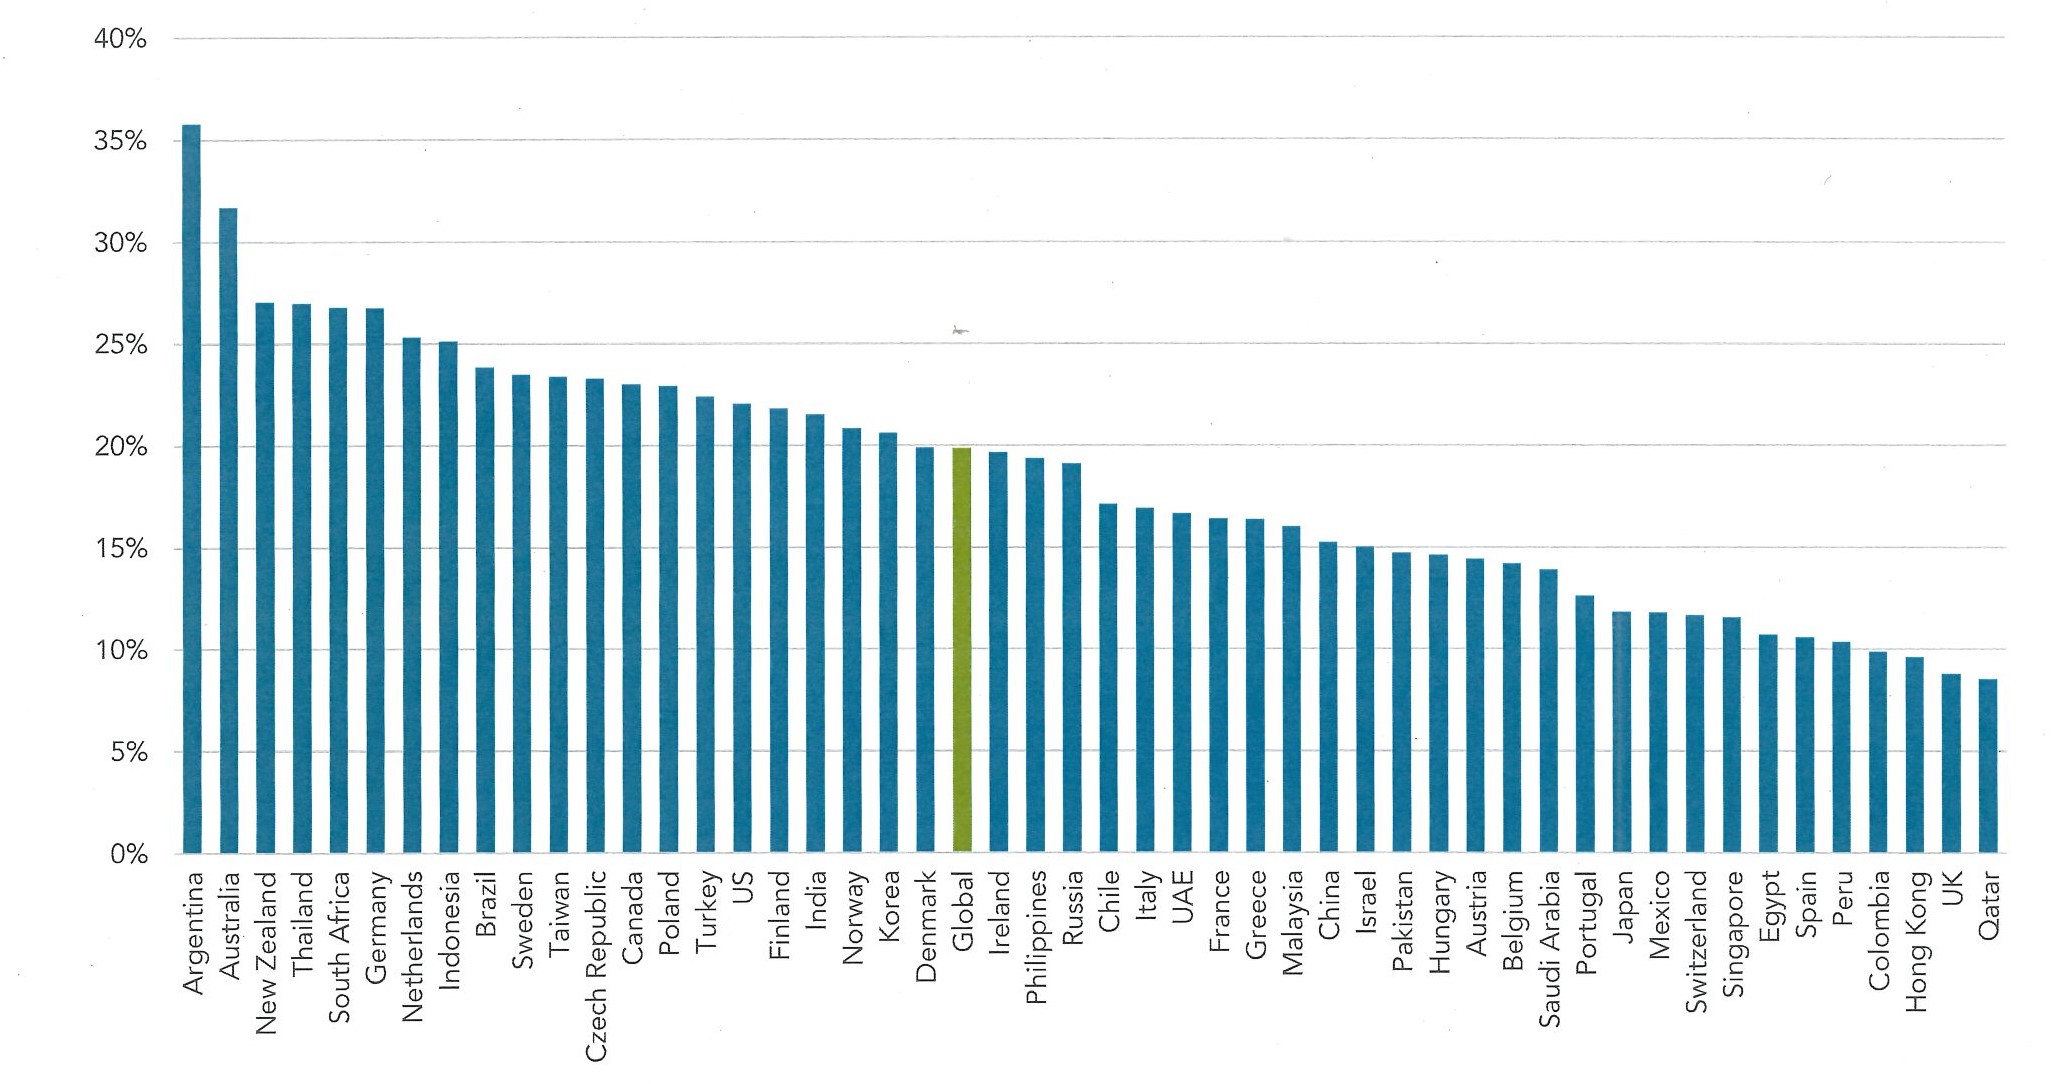
Figure 1 Disclaimer: Past performance is no guarantee of future results. Indices are not available for direct investment. Their performance does not reflect expenses associated with the management of an actual portfolio. Country returns are the country component returns of the MSCI All Country World IMI for all countries except the United States, where the Russell 300 index is used. ‘Global’ is the return of the MSCI All Country World IMI. Source: Frank Russell Company, all rights reserved.
Putting Some Perspective On Things
While we would all like to believe that we are past the worst of the coronavirus pandemic and that the economy is on its way to a complete recovery, we just cannot know for certain how long things will last. In the last week or so we have seen a significant increase in the number of new reported Covid-19 infections and the death toll will continue to climb over the coming months. While this may be disconcerting for some investors, it is important to put things in perspective.
It is essential to remember that investors react to news as it happens. Each day scientists and medical professionals are learning something new about the Covid-19 virus, how it mutates and changes, and effective ways of treating and preventing infections. This new information may challenge our knowledge and beliefs on treating pandemics at times. Markets, led by the actions of investors reacting to news, are likely to remain volatile for some time and market swings of significant magnitude may occur. Market volatility and swings are signs of a healthy market that is functioning as it should.
It is also essential to put the Covid-19 pandemic timeline in perspective to your overall financial planning goals timeline. The timeline of the Covid-19 pandemic will be a blip on the radar for financial plans that encompass six, seven or even eight decades of financial planning goals. Finally, the first half of 2020, and especially the last three months have shown that there is not always a strong correlation between economic conditions and financial market returns, especially in the short-term. It is important to not fall into the trap of drawing conclusions about future investment performance with limited and incomplete information.
Looking Ahead to the Fall
Investors may be in for a double dose of market volatility this fall as we approach the Presidential election in November. Once again, it will be important for investors to exhibit calm and rational behavior when new developments pertaining to the progression of the Covid-19 pandemic and potential treatment and containment options are interspersed with news about the Presidential election and new poll numbers are released. The lessons of the uncertainty of the last Presidential election should still resonate with investors. One thing to watch for is market performance leading up to the election. Since 1928, the incumbent party has won the November election 87% of the time when the S&P 500 is positive over the three months ahead of the election (August, September, October).
Sources: Wall Street Journal, Strategas Securities, U.S. Bureau of Labor Statistics