Before the brief ten percent market correction that began on January 26th and ended on February 8th, domestic equity (stock) markets enjoyed the longest period of market calm in history. Prior to the recent period of volatility, the S&P 500 had not retreated by 3% over one day or several days since November 4, 2016. The streak shattered the previous record set over two decades ago in 1995.
Because of the long period of market calm, the swift market declines of late January and early February may have felt foreign to many investors. Many investors may have felt the brief correction was the beginning of the much-anticipated bear market that many analysts have been calling for in recent months. Subsequently, some investors have exited the equity markets and sat on the sidelines to avoid further negative volatility. These investors have missed significant market gains since the brief period of poor market performance.
Long periods of relative calm in the markets, or long periods of negative market volatility for that matter, can distort our perception of what “normal” market behavior should look like. Long periods of calmness or negative volatility in equity markets are the rare exceptions, and certainly not the rule, of equity market investing. While rapid market downturns can test the mettle of many investors, emotional reactions to market volatility can have a detrimental effect on long-term financial success and portfolio performance.
As pointed out earlier, many investors have moved to cash positions to ride out the recent market volatility. Most of the investors who move to cash positions during periods of market volatility erroneously believe that they can avoid most of the painful down days in a market downturn and then jump back into the market when markets resume their positive upward trending again. The truth of the matter is, it is not that easy as positive and negative days occur randomly and a day or two (or more) of extremely negative performing days in the market can be followed in quick succession with a string of strong positively performing days in the market. Those of us who lived through the last bear market (2007 to 2009) can remember those wild day-to-day fluctuations vividly!
At this point you may be asking yourself, “so what does it matter if I miss a few days of high investment returns? Will it really make a difference if I can avoid most of the market downturn?” To answer that question, we turn our attention to Exhibit 1.
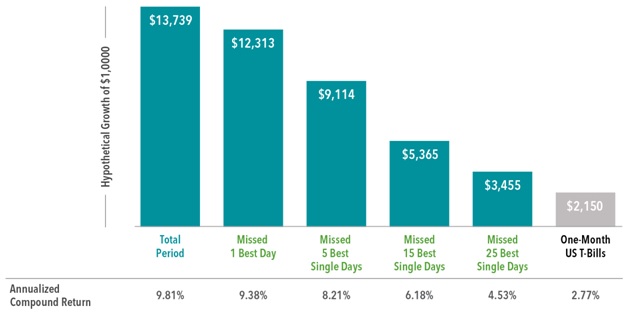
Exhibit 1 Disclaimer: In US dollars. For illustrative purposes. The missed best day(s) examples assume that the hypothetical portfolio fully divested its holdings at the end of the day before the missed best day(s), held cash for the missed best day(s), and reinvested the entire portfolio in the S&P 500 at the end of the missed best day(s). Annualized returns for the missed best day(s) were calculated by substituting actual returns for the missed best day(s) with zero. S&P data © 2018 S&P Dow Jones Indices LLC, a division of S&P Global. All rights reserved. One-Month US T- Bills is the IA SBBI US 30 Day TBill TR USD, provided by Ibbotson Associates via Morningstar Direct. Data is calculated off rounded daily index values.
As you can see from the data in Exhibit 1, missing just a dozen or so of the best days in an investment market of a nearly three decade long can have a dramatic impact on the performance of your investment portfolio. If you missed the 15 best single days in the S&P 500 index in the 1990 to 2017 timeframe, your annualized rate of return drops by over one-third from 9.81% to 6.18%. In twenty-eight years, there are approximately 7,056 market-trading days (252 days/yr. x 28 years). Missing just 0.21% of those days (15/7056) reduces your annualized rate of return by over one-third!
Let us look at these numbers in a slightly different way that may be more relevant to your retirement account. If we began with a $100,000 portfolio on January 1, 1990 and left it in the S&P 500 through December 31, 2017, our $100,000 portfolio grew at a 9.81% annualized rate of return and left us with $1,373,956.44. If we began with the same $100,000 portfolio on January 1, 1990 and missed the fifteen single best market days, our portfolio on December 31, 2017 was worth only $536,038.75: a difference of over $800,000! Now how appealing is the strategy of trying to sit out market volatility?
Conclusion
While market volatility can be nerve-racking for investors, reacting emotionally and changing long-term investment strategies in response to short-term declines could prove more harmful than helpful. While it may feel comforting to take action and do something during periods of negative market volatility, the cost of trying to time equity markets is just too high a price to pay for short-term emotional comfort!
Sources: Dimensional Fund Advisors, S&P Dow Jones Indices LLC, Ibbotson Associates