
“It was the best of times, it was the worst of times, it was the age of wisdom, it was the age of foolishness, it was the epoch of belief, it was the epoch of incredulity, it was the season of Light, it was the season of Darkness, it was the spring of hope, it was the winter of despair…”
One hundred and sixty years after they were first published, no opening lines in classic literature seem more appropriate to describe the economic and financial markets in 2018 than the opening lines in Charles Dickens masterpiece “A Tale of Two Cities.” Two thousand eighteen witnessed the strongest economic conditions America has experienced in over a decade. While in the investment world, equity and fixed income markets alternated between whipsawing periods of extreme volatility, and a placid treading of water at other times. The paradox continued beyond our domestic borders, economies around the globe continued to expand in 2018, while global equity markets suffered significant losses.
Economic Growth Surges Ahead
Key economic indicators and measurements provided ample evidence that the U.S. economy experienced robust growth in 2018. According to statistics compiled by the Bureau of Labor Statistics, real average hourly wages increased 0.8% on a seasonally adjusted basis from November of 2017 to November of 2018. This means that after taking into account for inflation, workers’ take home pay gave them an extra 0.8% of purchasing power to buy goods and services.
Perhaps the strongest measure of the economy’s strength was the unemployment rate, which hovered around 4% throughout all of 2018. Unemployment fluctuated from a high of 4.1% in January, February and March to a low of 3.7% in September, October and November. The U.S. economy has not seen an unemployment rate that low since 1969, or the better part of five decades. Another strong, closely related measure of economic health was the record number of job opportunities that existed in two thousand eighteen. In August, a record 7 million job openings existed, while 6.2 million Americans remained unemployed.
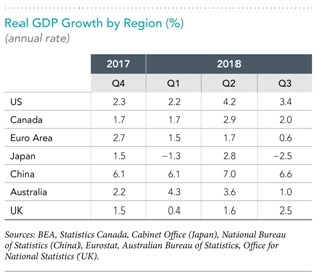
One of the most widely followed indicators of economic health, gross domestic product (GDP), also saw strong growth throughout 2018. The U.S. GDP grew at 2.2% in the first quarter, 4.2% in the second quarter, and 3.4% in the third quarter. Not too long ago, some economists and politicians believed that a return to 3% annual GDP growth would be impossible for the US economy.
Two final metrics confirmed the robust growth of the US economy in 2018. Inflation, as measured by the consumer price index (CPI) was running at a 2.2% annual increase through November 2018. The 2.2% rate is relatively tame, by historical measures, and is a good indication that the economy is not overheating or growing too quickly. Finally, US household net worth topped $109.4 Trillion during the third quarter of 2018, reaching record territory as higher home and stock values boosted the wealth of many Americans.
But economic growth was not constrained to the United States alone. Of the forty-five countries tracked by the Organization for Economic Cooperation and Development, forty-four were on pace to expand in 2018. Argentina, beset with problems with its currency, high inflation, and a devastating drought was the only economy expected to contract in 2018.
investment Markets Produce Negative Returns
Based on the strong economic performance in the United States and the rest of the world, one would have expected stronger investment performance from equities in 2018. The previous year provided plenty of evidence of the difficulty in predicting market performance and returns.
2018 started strong enough, picking up where 2017 left off. February introduced volatility into the marketplace amid concerns of rising inflation, and US stocks experienced a correction. Equity markets gained back what they lost earlier in the year and then some, with the S&P 500 index reaching an all-time high in late September. After September, however, US stocks retreated as fears of inflation, trade tariffs, and an aging bull market weighed on investors’ confidence and the sell-off accelerated in late December.
Equity investors found no safe haven overseas in 2018, as global markets lagged domestic markets throughout 2018. As measured by the MSCI All Country World Index, global equity markets ended 2018 down -9.4%. By comparison, the S&P 500 Index recorded a -4.4% total return for all of 2018. The fourth quarter was especially unkind to the S&P 500, with a –13.5% return for the last quarter of 2018. In spite of the negative return in 2018, the S&P 500 has still produced a gaudy 13.1% annualized return for the ten year time period ending December 31, 2018.
Within the global equity markets, there was a wide dispersion of returns. While 46 out of 47 individual countries experienced losses for the year, returns were widely dispersed among those 47 countries. Among countries categorized as developed, returns ranged from a – 24.1% in Belgium to a flat 0.0% return in New Zealand in 2018. In emerging markets returns ranged from + 27.1% in Qatar, to – 41.3% in Turkey, a difference of almost 70%.
Fixed income markets provided safety from market volatility in 2018, but provided very little in the way of investment returns as the Bloomberg Barclays Global Aggregate Bond Index returned +1.76% in 2018. The Bloomberg Barclays US Aggregate Bond Index fared worse, eking out a meager 0.01% gain.
Although it is rare, in some years there are just no safe havens for investors. 2018 was one of those years. It is important for investors to remember that negative returns are sometimes unavoidable in spite of the most disciplined and proven investment strategies.
Sources: The Wall Street Journal, Dimensional Fund Advisors